
Figure 5.
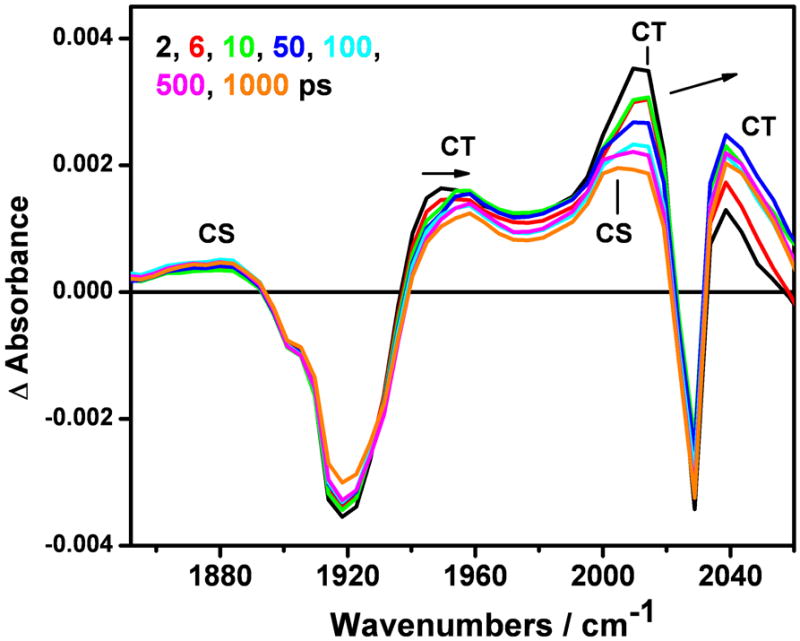
Picosecond TRIR spectra of ReI(dmp)(W)AzZnII measured at selected time delays (in ps) after 400 nm, ~150 fs excitation. Experimental points are separated by 4-5 cm−1. The arrows show the relaxation-related 3CT band shifts (the small 3CS rise is apparent only after background subtraction). Solution in 50 mM KPi buffer in D2O (pD ~7.0) at 21 °C.