
Figure 8.
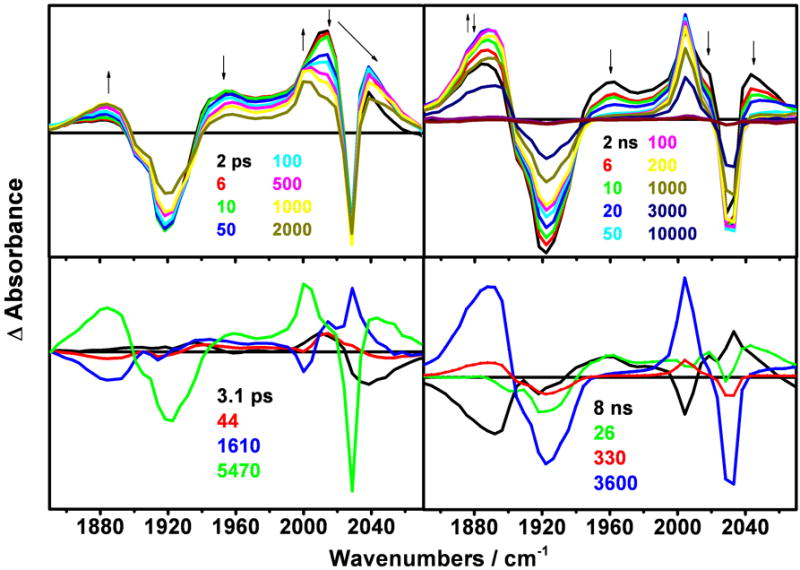
Top: TRIR spectra of ReI(dmp)(W)AzCuI measured in the ps time range after 400 nm, ~150 fs excitation (left panel) and the ns range after 355 nm, ~0.7 ns excitation (right panel). Bottom: DAS spectra corresponding to kinetics components specified in Table 1. The 5470 ps DAS (bottom left, green) results from extrapolation to long time delays, approximately corresponding to an early-ns spectrum.