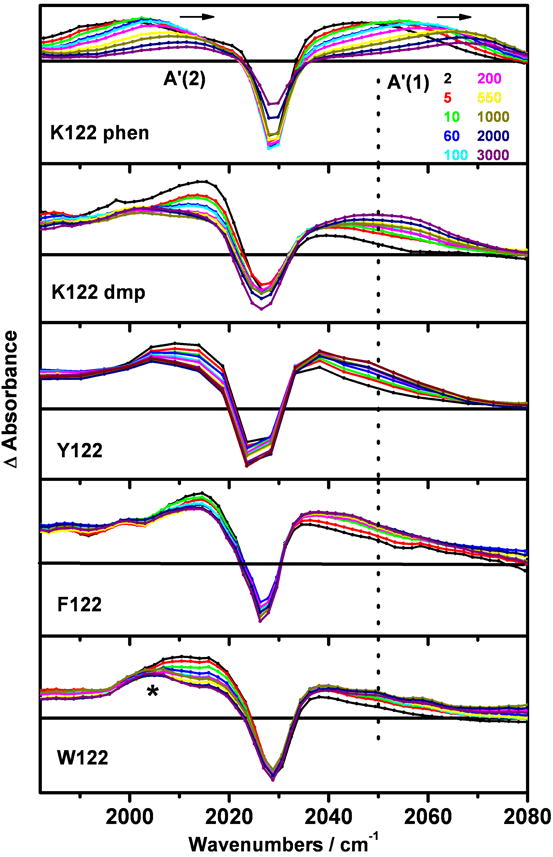
Figure 9.

Time-resolved IR spectra of Re(N,N)(A)-labeled azurins in the high-energy part of the ν(CO) region. From top to bottom: Re(phen)(K)AzCuII, Re(dmp)(K)AzCuII, ReI(dmp)(Y)AzCuII, ReI(dmp)(F)AzCuII, and ReI(dmp)(W)AzCuII (3-4 mM in KPi-D2O, pD ~ 7.1, 21 °C) measured at selected time delays (see the top panel) after 400 nm, ~150 fs laser-pulse excitation. The dotted line shows the position of the highest excited-state band of ReI(dmp)(K)AzCuII. Experimental points are separated by ~5 cm-1 for ReI(dmp)(Y)AzCuII and ~1.9 cm-1 for all others.
*: spectral feature due to the 3CS formation.
