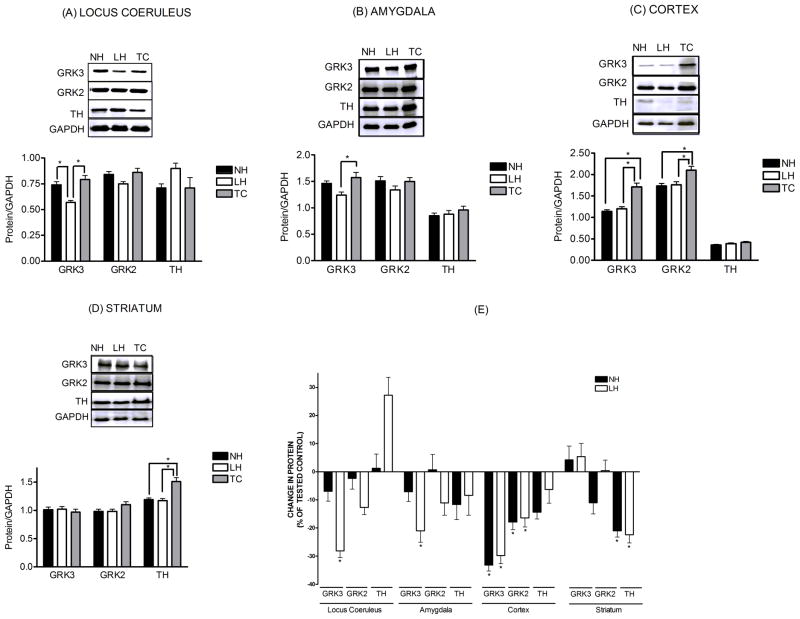
Figure 2.
Levels of GRK3, GRK2 and tyrosine hydroxylase (TH) expressed as a ratio relative to the loading control GAPDH. Shown above the quantified data are representative western blots of GRK3, GRK2 and TH for locus coeruleus, amygdala, cortex, and striatum. Also illustrated are the same data from each brain region, presented as changes in GRK3, GRK2 and TH levels of learned helpless (LH) and non-helpless (NH) rats expressed as a percent of the respective tested controls (TC). All data are presented as the mean± S.E.M., n=8–9. *-Significantly different from tested control (TC), p<0.05.

