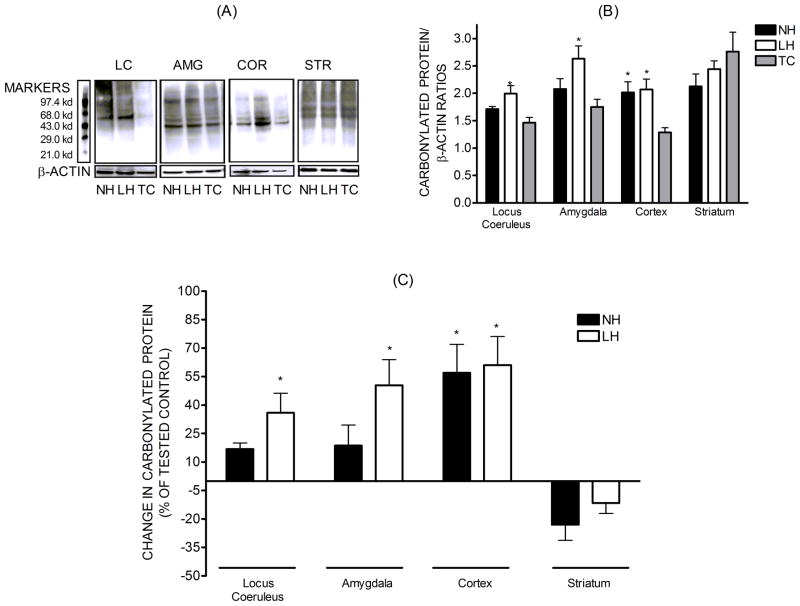
Figure 4.
Levels of carbonylated protein, a marker of oxidative stress, in tissue homogenates of locus coeruleus (n=3), amygdala (n=8–9), cortex (n=7–9), and striatum (n=8–9). The carbonylated protein levels were normalized against β-actin and presented as the mean± S.E.M. Also illustrated are the percent changes in carbonylated protein levels in each brain region relative to the respective TC. * - Significant change in protein levels, p<0.05.

