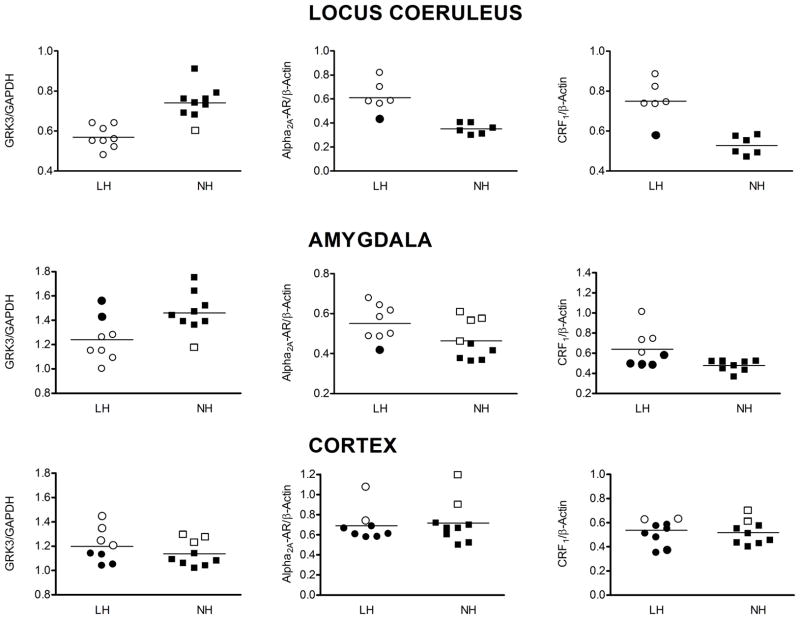
Figure 5.
K-means cluster analysis for identification of two clusters based on GRK3, α2A-AR, or CRF1 receptor level in locus coeruleus, amygdala or cortex of TSS rats. In each panel, circles represent data points from LH rats while squares represent data points from NH rats as determined by behavioral testing. Open and filled symbols represent the two clusters identified on the basis of the biochemical parameter represented in each panel.

