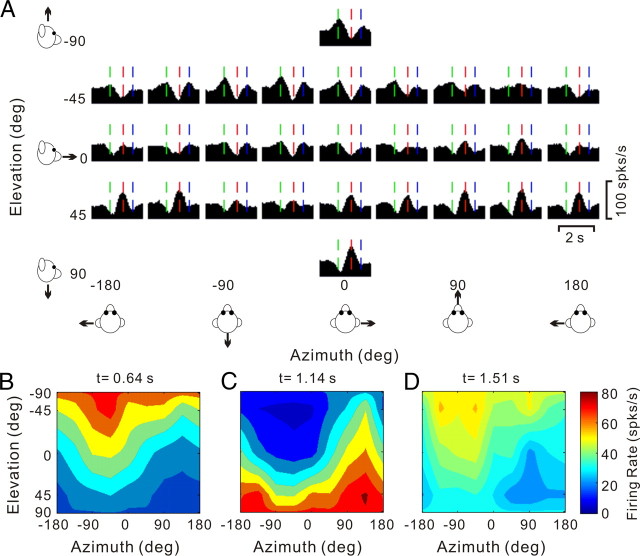
Figure 10.
Responses of a triple-peaked neuron. A, Average PSTHs for the 26 motion directions. Green, red, and blue vertical lines mark three distinct peak times. B–D, Color contour maps showing 3D tuning at the three peak times in A. Preferred directions were [azimuth, elevation]: [−50.7, −67.1°] (B), [124.6, 60.1°] (C), and [−73.3, −58.7°] (D). The corresponding DDI values were 0.83, 0.77, and 0.75, respectively.

