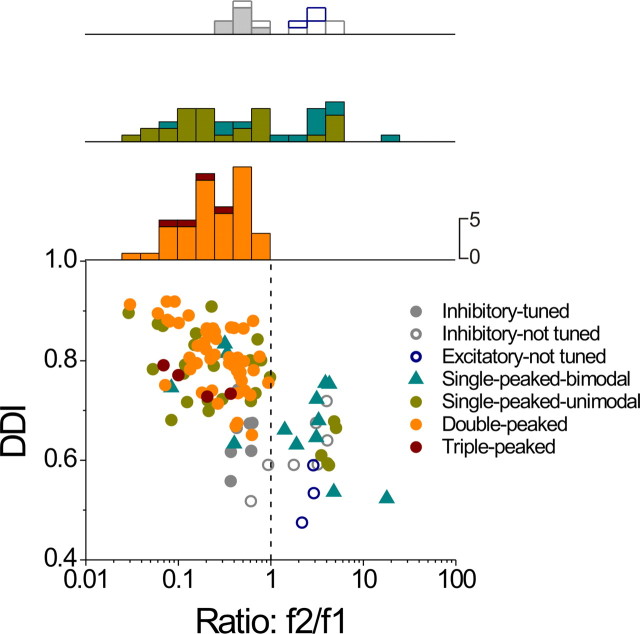
Figure 13.
Comparison between sinusoidal responses (f2/f1 ratio) and 3D tuning (DDI). Each point in the scatter plot corresponds to one cell, and symbol shape/color reflects its classification as inhibitory (tuned or not tuned, filled or open gray circles, respectively), excitatory but not tuned (open blue circles), excitatory single peaked (bimodal/unimodal, cyan triangles/green circles), double peaked (orange circles), or triple peaked (red circles). The top panels show the distribution of f2/f1 ratios for inhibitory (tuned and not tuned; gray bars) and excitatory not tuned cells (top histogram; blue bars), single-peaked cells (middle histogram; cyan and green bars), and double-peaked and triple-peaked cells (bottom histograms; orange and red bars, respectively).

