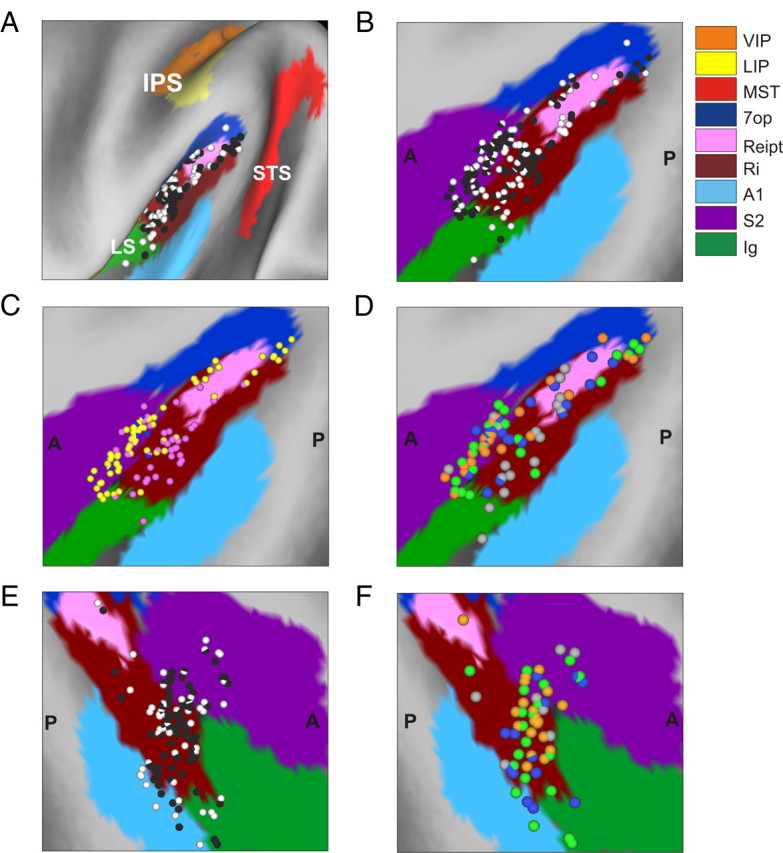
Figure 19.

Anatomical localization of recording sites within and around the lateral sulcus. A, Lateral view of a 3D surface reconstruction of the left hemisphere of monkey U, with cell locations mapped onto the surface and with the three major sulci (IPS, LS, and STS) identified. Each dot corresponds to a cell, with black and white dots showing cells that were responsive and nonresponsive to sinusoidal motion, respectively. B–F, show flat maps of the brain areas around the lateral sulcus for the left hemisphere of monkey U (B–D) and the right hemisphere of monkey J (E, F). Different functional brain areas are color-coded as indicated in the legend. The color scheme for the data points representing individual cells is as follows. A, B, E, Black dots: responsive cells; white dots: nonresponsive cells (sinusoidal testing). C, Yellow dots: cells responding at the first harmonic to sinusoidal stimuli; pink dots: second-harmonic cells; blue dots: cells responding at both the first and second harmonics (sinusoidal testing). D, F, Gray dots: inhibitory cells; green dots: single-peaked unimodal cells; blue dots: single-peaked bimodal cells and untuned excitatory cells; orange dots: double-peaked cells (transient translation testing).
