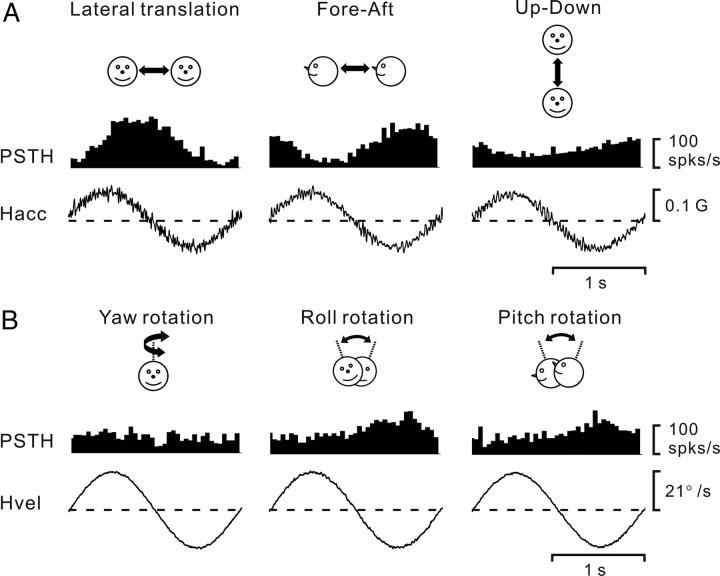
Figure 2.
A, B, PSTHs (averaged over multiple cycles) from an example neuron during 0.5 Hz sinusoidal translation (A) and rotation (B). Motion directions are indicated by the cartoon drawings. Stimulus traces shown represent linear acceleration (Hacc, A) or angular velocity (Hvel, B) of the head. The cell's response modulated significantly during all three translation directions, namely, lateral (708.1 spikes/s/G, p_f1 < 0.01, f2/f1 = 0.029), fore–aft (546.8 spikes/s/G, p_f1 < 0.01, f2/f1 = 0.114), and up–down (286.6 spikes/s/G, p_f1 < 0.01, f2/f1 = 0.159) motions. The cell also modulated significantly during roll (1.9 spikes/s/°/s, p_f1 < 0.01, f2/f1 = 0.236) and pitch (1.2 spikes/s/°/s, p_f1 < 0.01, f2/f1 = 0.409) rotations, but not during yaw rotation (p_f1 > 0.01 and p_f2 > 0.01).

