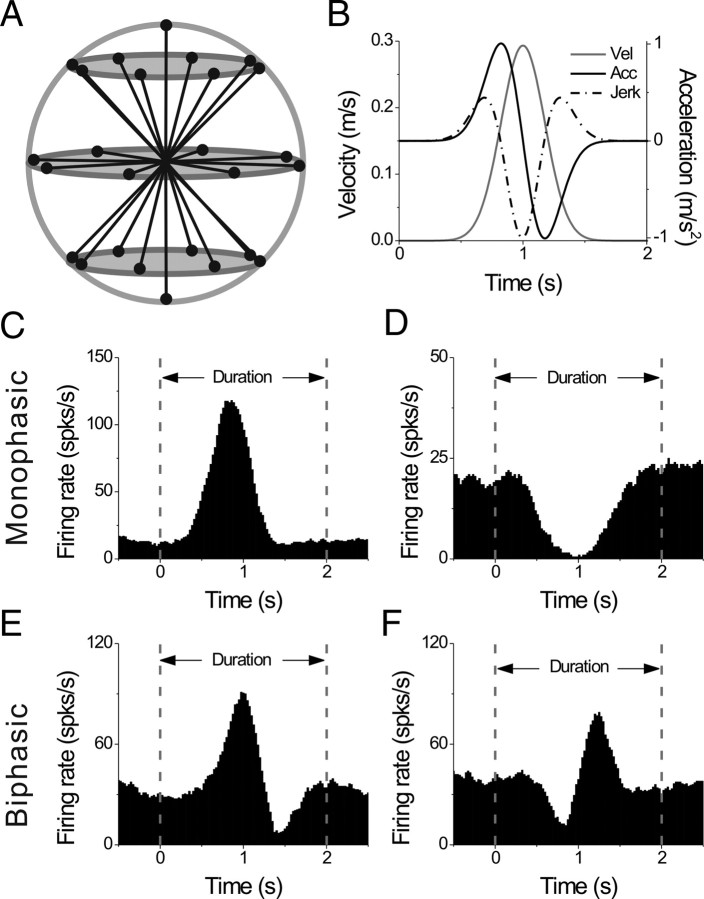
Figure 5.
Transient stimuli and examples of responses. A, Schematic of the 26 movement trajectories evenly spaced in 3D, 45° apart in both azimuth and elevation. B, The 2 s translational motion stimulus: velocity (gray curve), acceleration (black curve) and jerk (dashed-dot curve). C, D, Example average PSTHs with monophasic-positive and monophasic-negative temporal response profiles, respectively. E, F, Example average PSTHs with biphasic responses. Dashed lines indicate the onset and offset of the stimulus.

