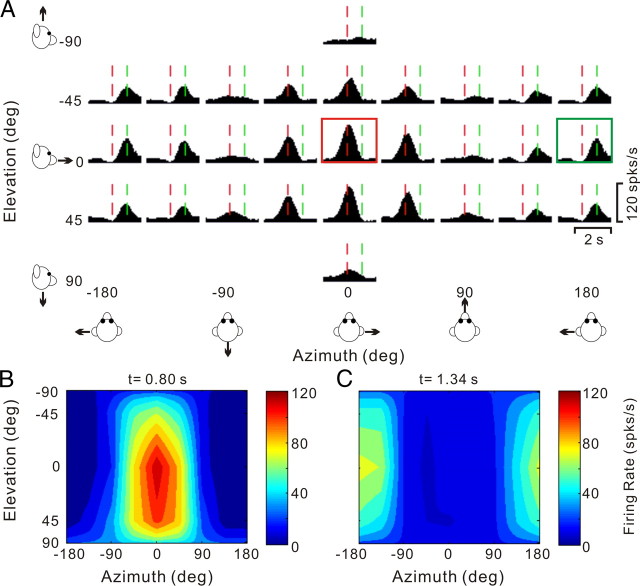
Figure 9.
Spatiotemporal responses for a double-peaked neuron. A, Average PSTHs for each of 26 directions of translation. The PSTH in the red square illustrates the first response peak occurring at t = 0.80 s (vertical red lines); the PSTH in the green square illustrates a second response peak occurring at t = 1.34 s (vertical green lines). B, C, Color contour maps showing the 3D tuning at the two peak times indicated in A. The tuning for the first peak (red square in A) is shown in B, with a direction preference at azimuth −2.8° and elevation 14.4° (DDI = 0.92). The tuning for the second peak (green square in A) is shown in C, with a direction preference at azimuth −175.7° and elevation −2.6° (DDI = 0.86). The difference in direction preference between the two peaks is 166°.

