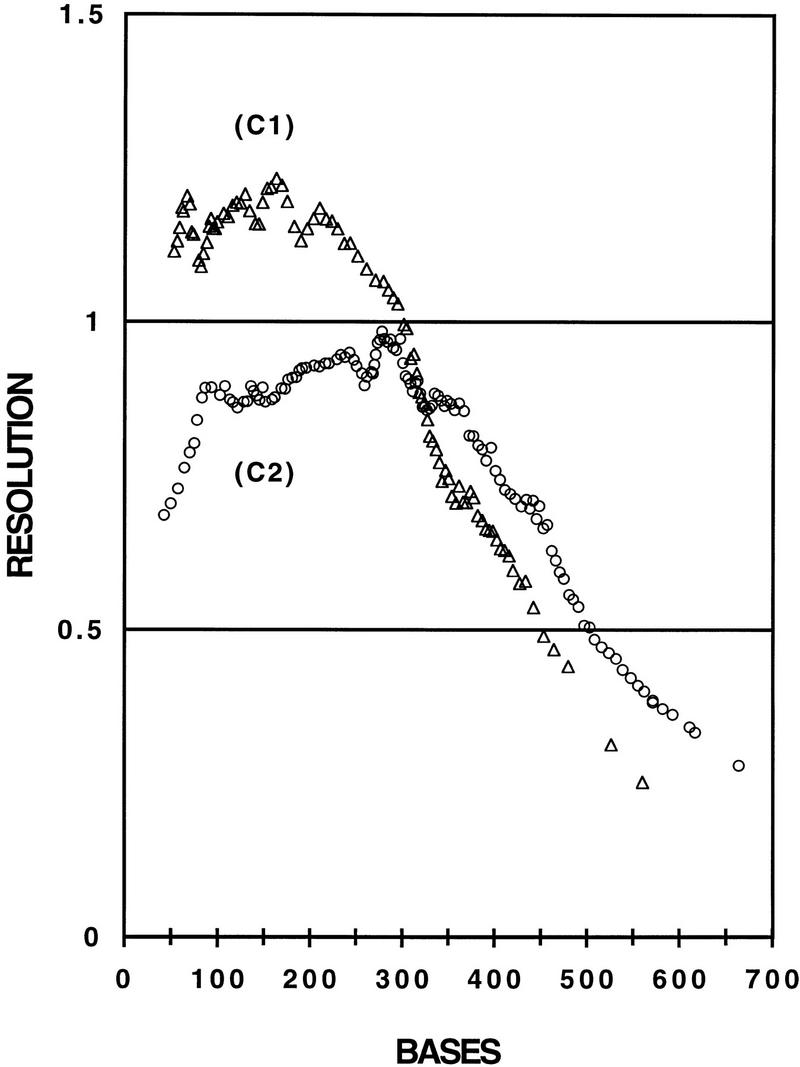
Figure 2.

Averaged single base resolutions vs. base number calculated for samples 1–6 and 7–12 run at 200 V/cm with 4% LPA (C1) and at 150 V/cm with 3% LPA (C2) at 45°C, respectively, on a microdevice with 11.5 cm effective separation distance. Only the A traces were used for the calculation. (The base count starts with base number 35, as the sequences were not readable below 35 bases).
