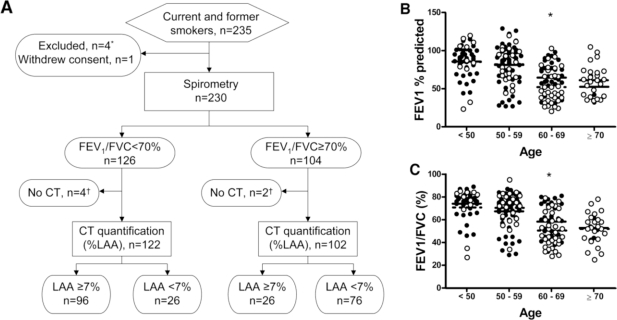
Figure 1.
Schematic overview of the study design and FEV1% predicted and FEV1/FVC ratio among ever-smokers. (A) Flowchart of the recruitment, exclusions, dropouts, measurements, and results in evaluating the diagnostic accuracy of spirometry (FEV1/FVC < 70%) in the detection of emphysema, as defined by CT quantification (Low Attenuation Area; LAA ≥ 7%) is shown. The number of participants recruited, excluded, and measured is shown within the respective boxes. # Four subjects were excluded (three for concomitant lung disease; one for α-1-antitrypsin deficiency). ¶ Six total subjects did not have CT performed (two expired; three lost to follow-up; one withdrew consent). (B) FEV1% predicted was plotted by age group among current (N = 133, solid circles) and former (N = 91, open circles) smokers. (C) FEV1/FVC ratio was plotted by age group among current (N = 133, solid circles) and former (N = 91, closed circles) smokers. The group means are depicted by solid (current smokers) and dashed (former smokers) lines. * P < 0.05 current smokers versus former smokers.

