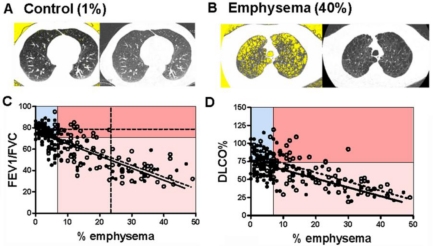
Figure 3.
Correlation between PFTs and % emphysema in ever-smokers. Representative quantitative CT images of lung (left images) are matched to conventional CT images of the same lung (right images) from individuals without (A) and with (B) emphysema. Yellow background within lung margins (left images) was quantified as a percent of whole lung to determine the percent emphysema (1% and 40%, respectively; see Methods). (C) FEV1/FVC ratio was plotted against % emphysema, with regression lines in current (N = 133; solid line) and former (N = 91; dashed line) smokers. P < 0.0001; r = −0.7136 and r = −0.7574 Goodness of Fit for current and former smokers respectively. The lines are similar in slope (P = 0.78) and elevation (P = 0.17). The graph is divided into quadrants based on cutoff values for FEV1/FVC (70%) and % emphysema (7%). Additional dashed lines identify FEV1/FVC 78% (horizontal) and 23% emphysema (vertical). (D) DLCO% predicted plotted against % emphysema with regression lines in current (N =126; solid line) and former (N =89; dotted line) smokers. P < 0.0001; r = −0.4690 and r = −0.7074 Goodness of Fit for current and former smokers respectively. The lines are significantly different in elevation (p = 0.0003) but not slope (P = 0.79). The graph is separated into quadrants based on cutoffs for DLCO% (75%) and % emphysema (7%).

