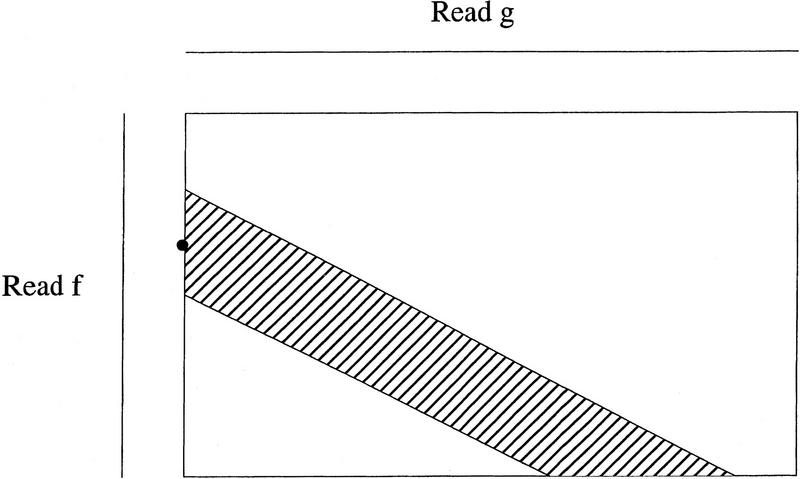
Figure 3.
Computation of a global alignment of clean reads f and g with the maximum score over a band. The rectangle represents the dynamic programming matrix, with the rows corresponding to the bases of read f and the columns to the bases of read g. The band is indicated by a shaded area and the start position of an optimal local alignment between raw reads f and g is indicated by a dot.

