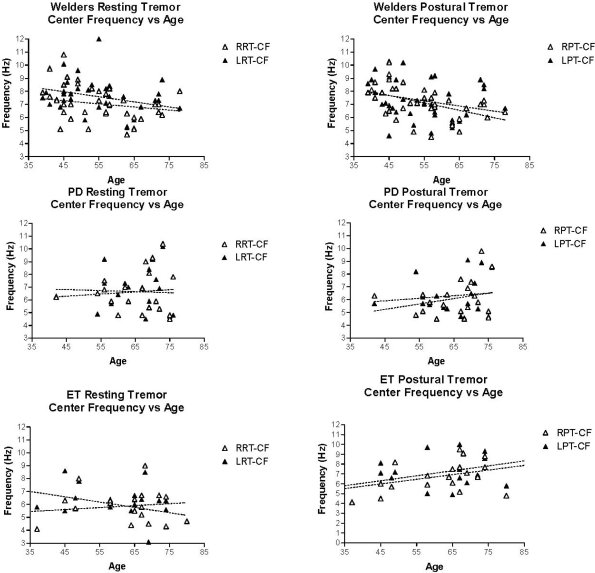
Figure 4.
Center Frequency vs. Age. Upper panels show the results of linear regression analysis in welders. The slope of the lines does not differ significantly from zero with the exception of the right sided postural tremor in which Center frequencies show an age-dependent decrease (p < 0.05). The middle panels show the results of linear regression analysis in PD subjects. None of the slopes differ significantly from zero. The lower panels (ET) indicate an age-dependent increase in postural tremor Cf on the right side. Regression line is significantly different from zero (p = 0.04).

