
Figure 2.
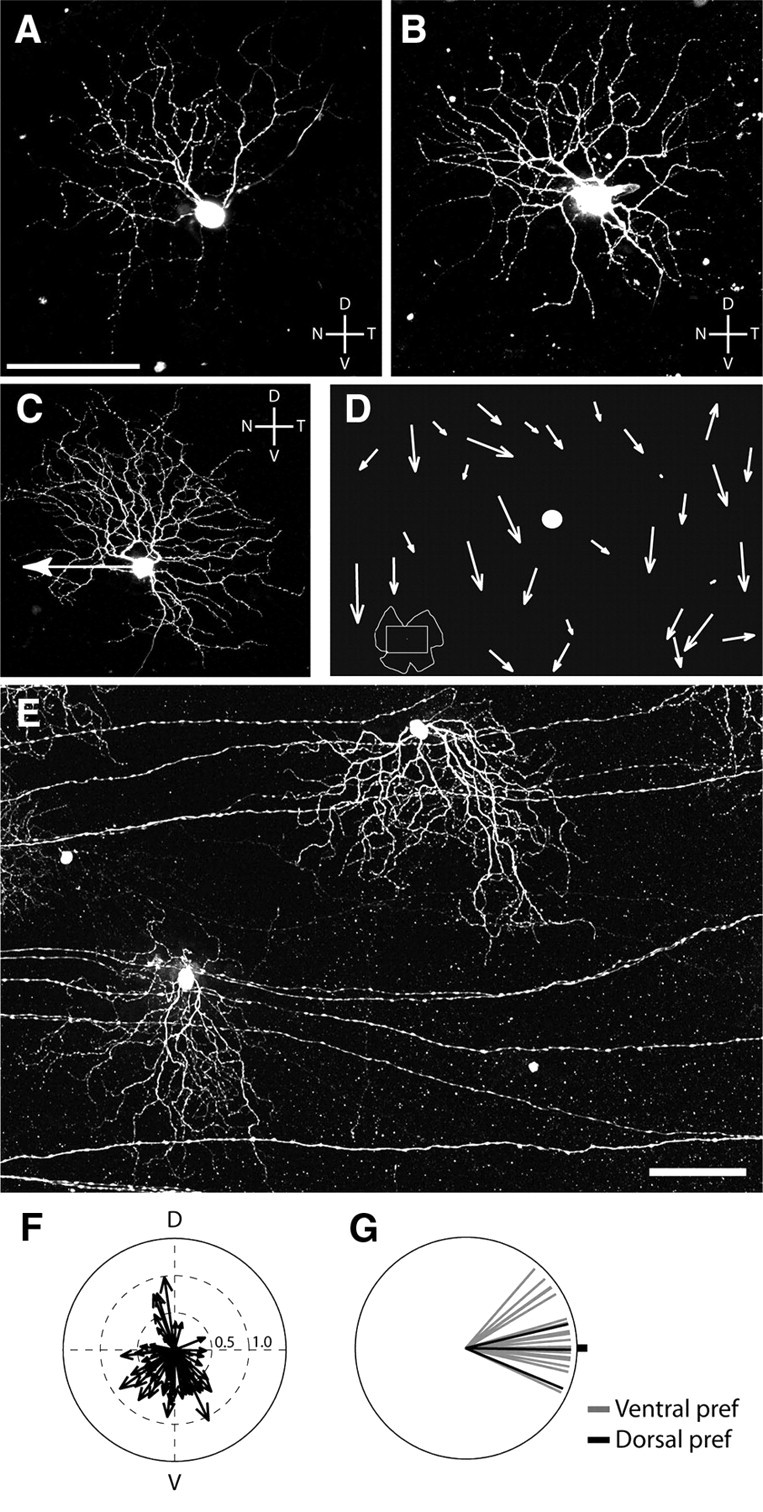
Relationship between structure and function of ooDSGCs. A, B, Morphology of W9 RGCs does not correlate with their preferred direction. Confocal stack z-projection showing two W9 cells that were injected with Lucifer yellow following recording. Scale bar, 100 μm. C, DRD-4-RGC filled with Lucifer yellow following recording. Arrow indicates preferred direction, which is distinct from the orientation of its dendritic asymmetry. D, Sketch of part of a whole mounted retina (see inset at bottom left) showing dendritic asymmetry of the BD-RGCs. Arrows originate from the somas and point in the direction of dendritic asymmetry. Length of arrow is proportional to degree of dendritic asymmetry. Dot, Optic disc. E, Micrograph of two BD-RGCs from the retina. Scale bar: (in E) C, E, 100 μm. F, Polar plot summarizing the dendritic asymmetry of BD-RGCs from a retina similar to that shown in D and E. G, Relationship between dendritic asymmetry and direction selectivity of 22 BD-RGCs. The preferred direction is plotted relative to the direction of the dendritic arbor (dot). Black lines indicate dorsal-preferring cells from the dorsal margin of the retina.