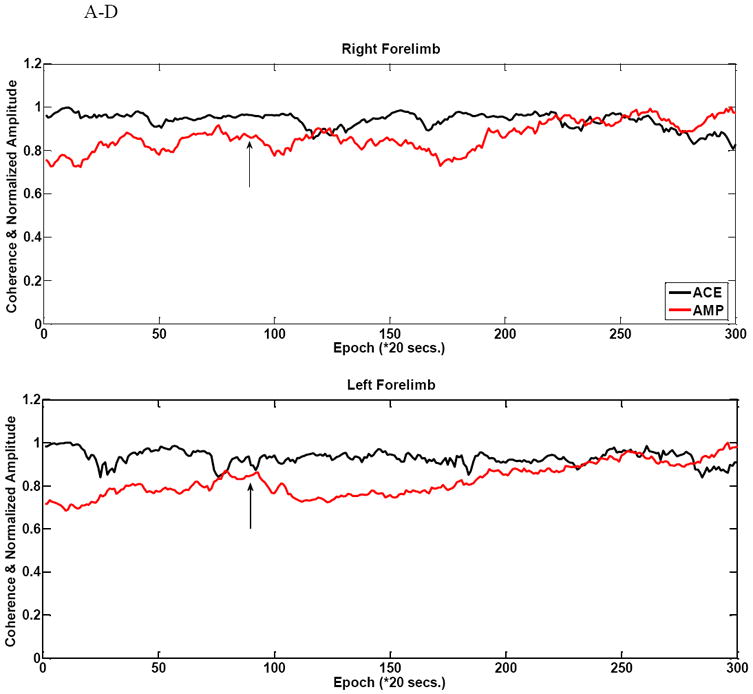
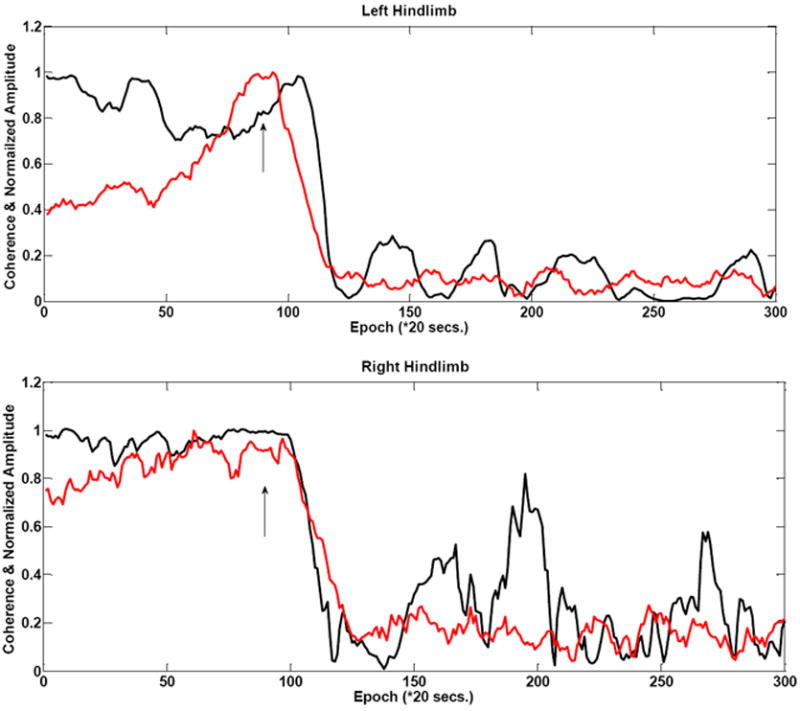
Figure 4.


Figure 4 A-D shows comparative amplitude vs. ACE stability during baseline in a 13g weight (rat #6) injury animal in all four limbs. There is a comparatively larger amount of variability during the baseline period as seen for these amplitude measurements. There is some drift in the coherence estimate. This example shows a moderate decrease in ACE value with the injury induction as evidenced by slope change in the left hindlimb. The arrows indicate injury time.
