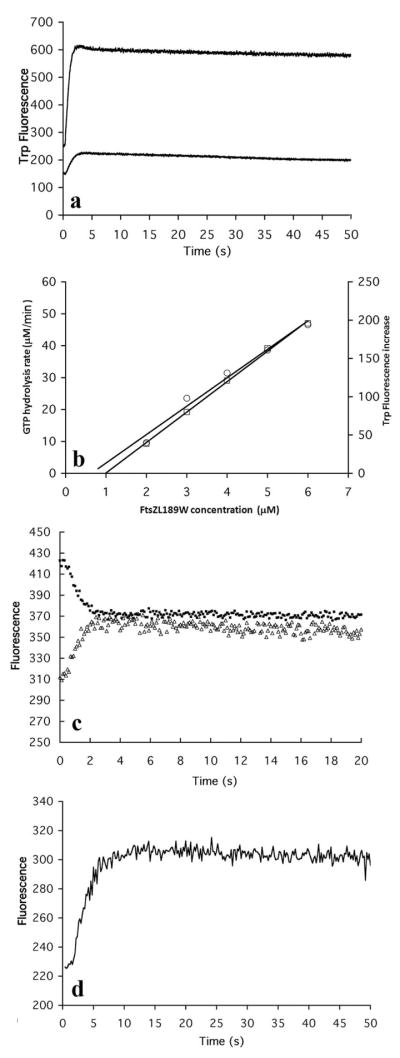
Figure 4.

(a) Time course of assembly of L189W measured by trp fluorescence. The FtsZ concentration was 2.5 μM and 5 μM for the lower and upper curves. (b) L189W has a critical concentration 0.8-1 μM, measured by both GTP hydrolysis rate (left ordinate, circles) and trp fluorescence increase (right ordinate, squares). (c) The assembly of L189W/F268C measured by increasing trp fluorescence (lower curve) and by decreasing donor fluorescence in FRET (upper curve). (d) Assembly of 10 μM L189W in EDTA buffer measured by trp fluorescence increase.
