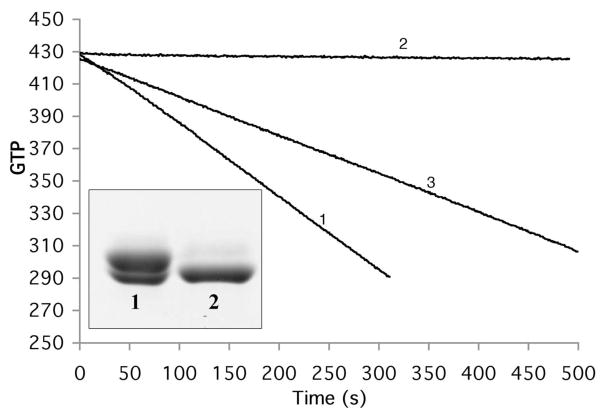
Figure 7.
GTP hydrolysis of S154CY222C with and without disulfide bond formation assayed by consumption of NADH. The negative slope is proportional to the rate of GTP hydrolysis . Before treatment with CuSO4 the rate was 26 GTP/min (for 5 μM protein, line 1). After treatment with CuSO4 the slope was zero, indicating a complete loss of GTP hydrolysis (line 2). When the protein was subsequently treated with DTT, hydrolysis was recovered to 57% (line 3). The inset shows SDS-PAGE analysis of disulfide bond formation of S154C/Y222C. The protein purified by the normal procedure shows two closely spaced bands (lane 1); following treatment with 50 μM CuSO4 the upper band is converted to the lower band, which runs faster because of the intramolecular disulfide (lane 2).

