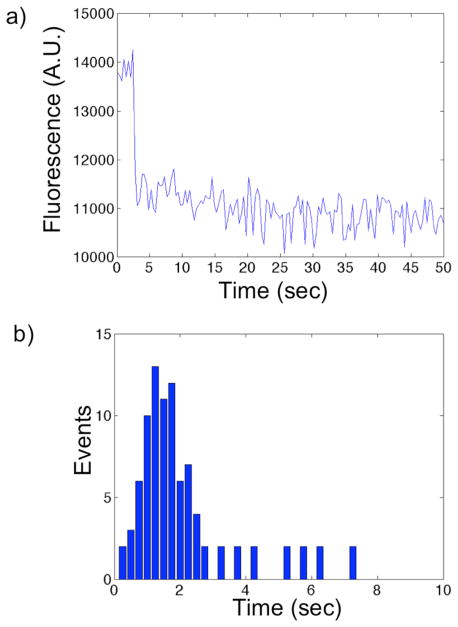
Figure 4.
a) A plot of the fluorescence intensity versus time of a representative single nanodot containing a single Rhodamine Red-labeled DNA; the single step loss of fluorescence intensity derives from the PvuII cleavage of the DNA (200 ms exposure time). b) Representative histogram of single-molecule DNA cleavage events over an entire nanoarray.

