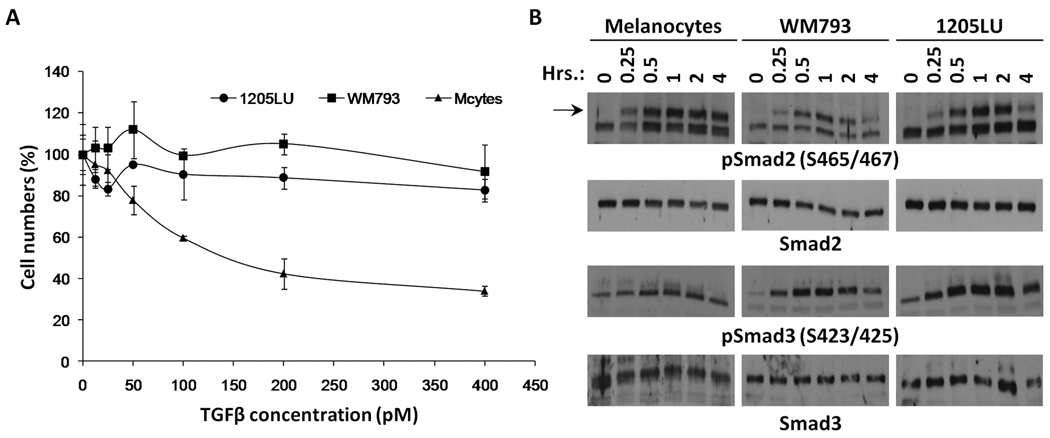
Figure 1. Biological response of melanoma lines and melanocytes to TGFβ.
A. Melanoma cell lines are resistant to TGFβ treatment. 3–4 × 10⁴ 1205 LU, WM793 and melanocytes were seeded in 24-well plates. The following day, TGFβ was added at concentrations ranging from 12.5 to 400 pM. Each concentration was done in triplicate. Four days later, viable cells were counted using a Beckman Coulter. (cells with TGFβ/ cells without TGFβ) × 100 is expressed as a function of TGFβ concentration (pM). B. Phosphorylation of Smad2 and Smad3 induced by TGFβ treatment in melanoma lines, WM793 and 1205LU, and melanocytes. 4–5 × 10⁵ cells were seeded in 35 mm dishes. The following day, cells were serum-starved for about 16 hours, before the addition of 100 pM of TGFβ for increasing periods of time, as indicated. At the end of the indicated period, whole cell extracts were made. Immunoblots were performed using antibodies against the C-terminal phosphorylated form of Smad2 (pSmad2(S465/467)) or Smad3 (pSmad3(S423/425)). Anti-total Smad2 and Smad3 antibodies were used for normalization.

