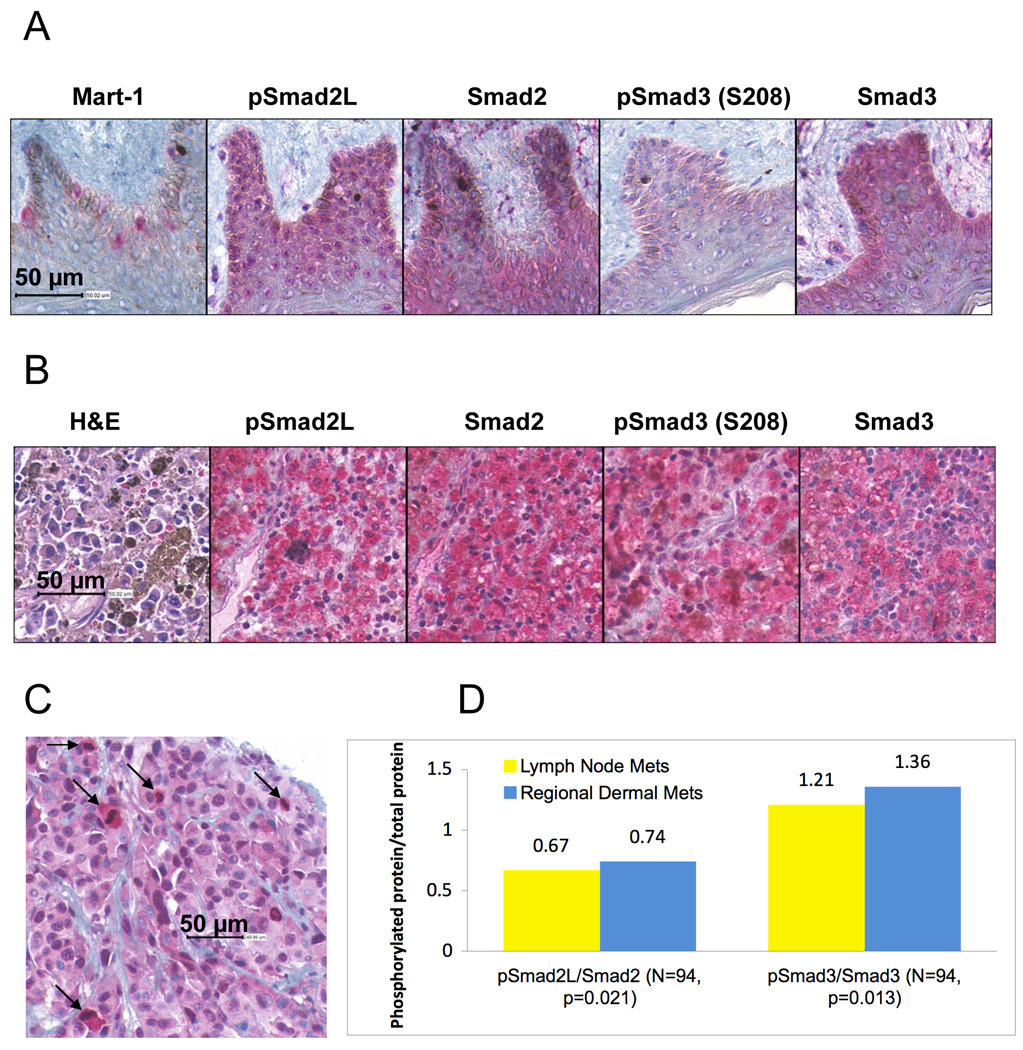
Figure 6.
Smad linker phosphorylation and Smad expression in normal human skin sections and melanoma samples. 4-µm sections of normal skin (A) and of the melanoma tissue microarray containing human melanoma samples (B), were stained using antibodies against Mart-1 (only normal skin), phosphoSmad2 (S245/250/255; pSmad2L), phosphoSmad3 (S208), Smad2 and Smad3. (C) One area of a melanoma core showing an association between high staining for phosphoSmad2 (S245/250/255) and mitotic figures (arrows). (D). Comparison of the ratios phosphoSmad2 (S245/250/255)/Smad2 (pSmad2L/Smad2) and phosphoSmad3 (S208)/Smad3 (pSmad3/Smad3) between regional dermal metastases (Mets) and lymph node metastases. N is the total number of samples submitted to one-tailed t-test. P value was generated through one-tailed t-test. The images were sub-samples from the whole slide images at 40X equivalent.

