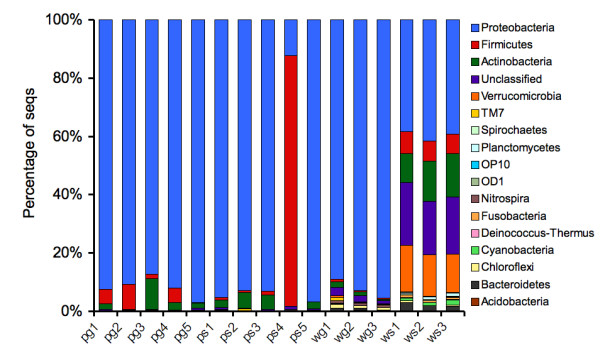
Figure 1.

Phylum level abundance profiles using 16S rRNA sequence classifications. Columns reflect the percentage of 16S rRNA sequences assigned to each phylum using the RDP classifier. All ws samples show a more even representation of Proteobacteria, Firmicutes, Actinobacteria, and Verrucomicrobia, as well as a higher representation of sequences that could not be assigned to any phylum (with a confidence threshold of 80%). We also observe a spike in Firmicutes abundance in a surface water-treated phyllosphere sample 4 (ps4). In all other samples, Proteobacteria 16S rRNA sequences tend to dominate the profiles.
