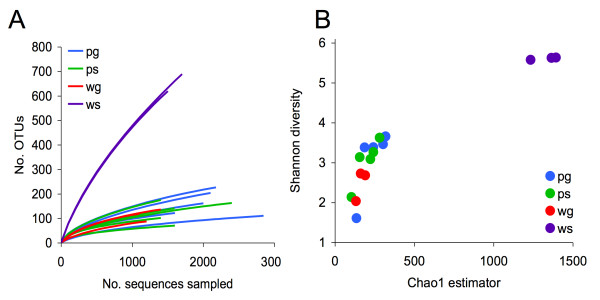
Figure 3.
OTU-based bacterial diversity analysis of water and crop samples. (A) Rarefaction curves displaying the average number of OTUs discovered by random sampling within each sample. We observe a higher diversity in all surface water samples (ws) relative to fruit surface and groundwater samples. (B) This increased diversity is also apparent through the Chao1 and Shannon diversity estimators. To avoid bias due to different sampling depths, we first rarefied the data by randomly selecting 1100 sequences from each sample. Note that Chao1 estimates for total species-level diversity in surface water samples consistently exceed 1000 species, while all other environments fall below 500.

