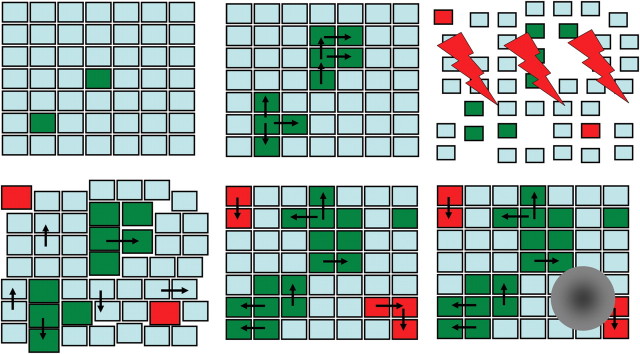
Figure 1.
A representation of model assumptions. Each small square represents a stem cell niche. Cyan squares are normal stem cell niches, green squares are spontaneously initiated pre-malignant niches and red squares are pre-malignant niches initiated by radiation. The order of panels (left to right) represents a time sequence: two niches are spontaneously initiated and grow by invasion of adjacent niches (black arrows). Radiation (lightning symbols) reduces the number of cells in all niches (squares become smaller) and eliminates some niches entirely (gaps). It also initiates two new niches (red squares). After exposure, killed cells are replaced by compensatory proliferation of surviving cells (gaps disappear, initial normal niche sizes are restored) and pre-malignant niches expand in size (promotion, shown by larger green squares). Over time, promotion is reversed (green squares return to default size), but invasion of normal niches by pre-malignant ones continues and spontaneous initiation continues as well. Eventually, malignant transformation occurs in one of the pre-malignant niches and a tumour is formed (grey mass).

