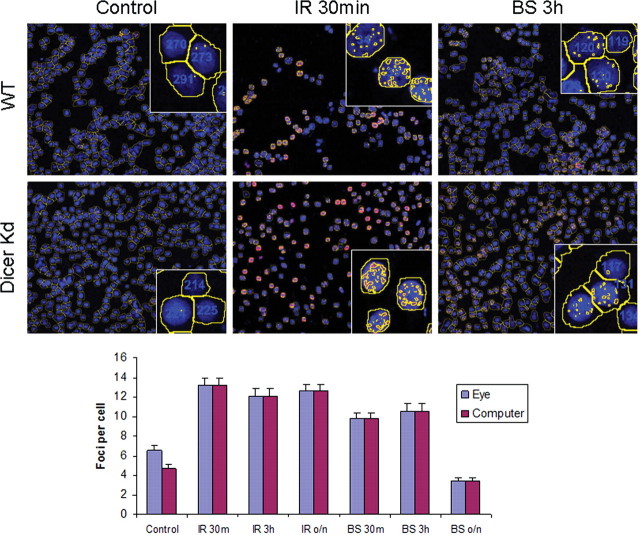
Figure 2.
Automated foci counting performed by the IP Labs software. Top: HCT-116 cells from the co-culture experiment are shown. WT, top row, wild-type cells; Dicer Kd, bottom row, Dicer knockdown cells. Blue DAPI stained nuclei are shown, gamma-H2AX foci are stained in red but yellow spots indicate that the foci were seen and counted by the IP Labs software. Likewise, yellow outlines were generated by the software to distinguish individual cell nuclei. Bottom: The gamma-H2AX foci per cell were counted in wild-type HCT-116 cells either manually by eye (blue bars) or using the IP Labs computer software (red bars). The error bars represent the SEM for ∼200 cells in three separate microscopic fields.

