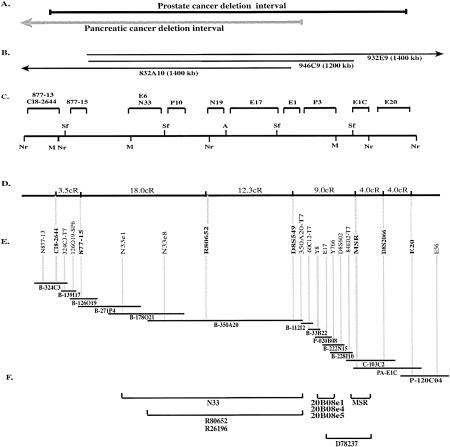
Figure 1.
Physical and transcript map of the 8p22 homozygous deletion interval. (A) Extent of the target interval (Bova et al. 1996; Levy et al. 1999). (B) Selected YAC clones that cover the deletion interval and their approximate extent (Bookstein et al. 1994). The numbers refer to the CEPH database YAC name; the approximate sizes of YAC clones are given in parenthesis. (C) Long-range restriction map of the YAC clones encompassing the interval (adapted from Bova et al. 1996). (D) Two-point distances between the indicated markers in cR based on the analysis with the Stanford G3 RH panel. (E) Minimal-tiling path contig of the deletion interval. Only selected markers are shown for simplicity. Those shown in boldface type have also been used for RH analysis. Vertical gray lines connect markers to the bacterial clones with which they tested positive. (Prefix P) PI clones; (PA) PAC clones; (B) BAC clones; (C) cosmid clones. (F) Location of known genes and partial cDNAs described in Tables 3 and 4. Horizontal bars indicate the clones to which transcripts have been localized.

