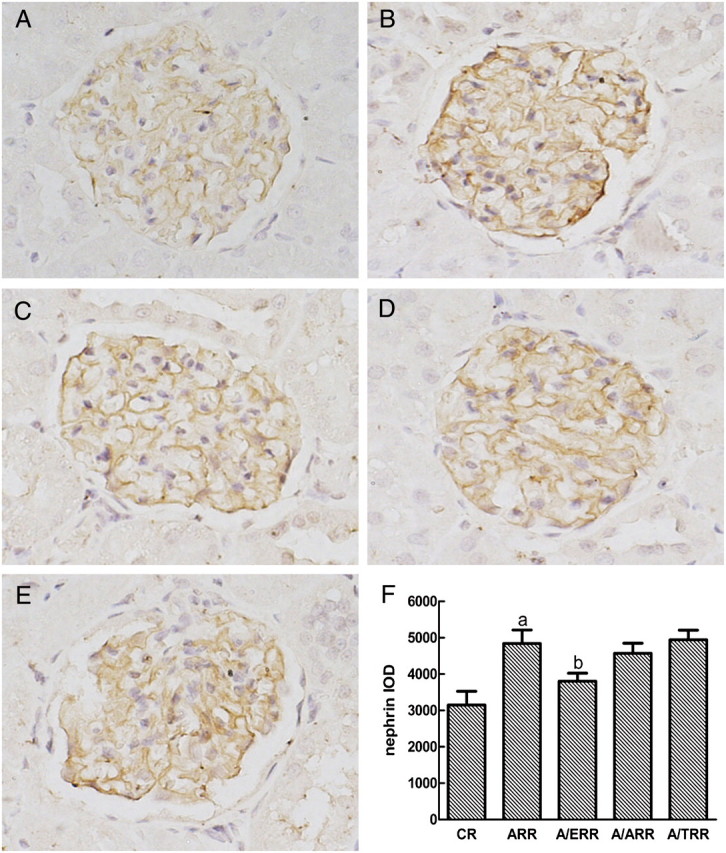
Fig. 5.

Immunostaining for nephrin expression in glomeruli from different groups. A–E indicate the representative photomicrographs of nephrin-stained glomeruli from vehicle-treated controls (CR), aldosterone-infused rats (ARR), and eplerenone (A/ERR)-, amlodipine (A/ARR)- and telmisartan (A/TRR)-treated animals, respectively. F. Analysis of the intensity of nephrin staining with mean integrated optical density (IOD) expressed as means ± SD (arbitrary units). a, P < 0.01 vs. CR; b, P < 0.01 vs. ARR (original magnification × 400).
