
Figure 4.
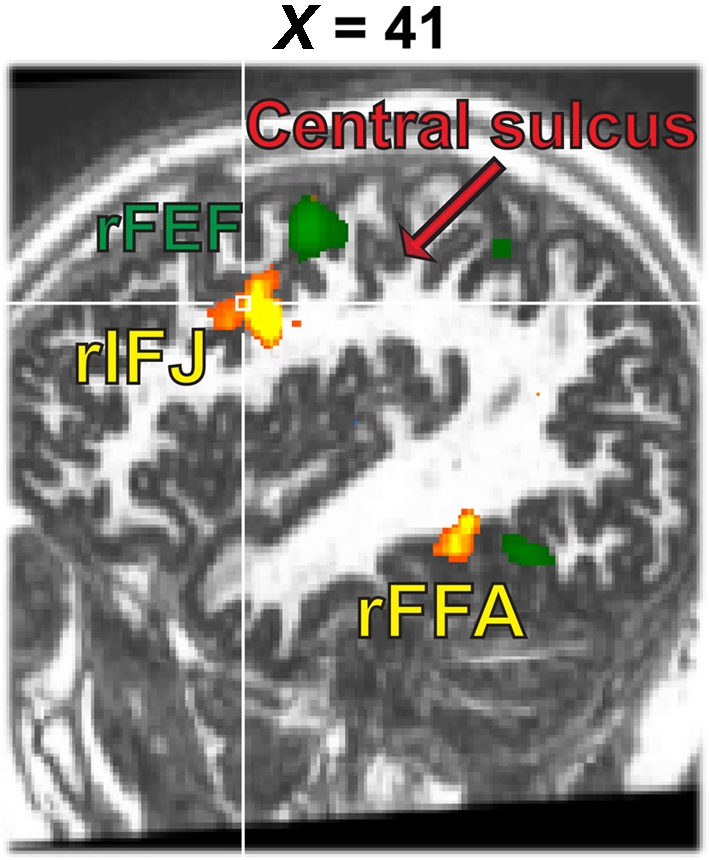
Times courses extracted from ROIs within each participant in Experiment 2, both IFJ and FFA were identified by the localizer scans (faces vs tool, p < 0. 0001; N = 6). Mean percent signal change (PSC) is plotted along the y-axis, repetition time (TR) is plotted on the x-axis. The colored bars in the figure are shifted by two timepoints to accommodate the HRF.