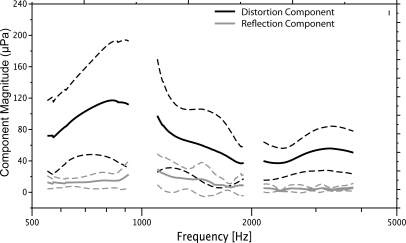
Figure 1.
Mean DPOAE component magnitude for three, octave-wide intervals: 0.5–1 kHz, 1–2 kHz, and 2–4 kHz. The black lines display the nonlinear component from the overlap region around f2, f1 and the gray lines represent the reflection component from the DP region at 2f1 − f2. The dashed lines outline ±1 standard deviation.

