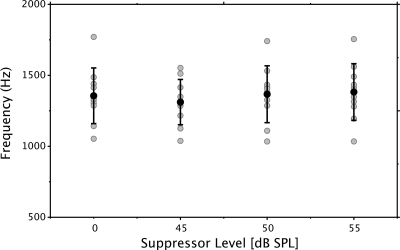
Figure 3.
Knot frequencies derived from the one-knot spline model. The knot frequency was not constrained a priori. Gray symbols represent individual data points. Black symbols represent the mean value for each experimental condition (no-suppressor and suppressors at 45, 50, and 55 dB SPL). The error bars represent ±1 standard deviation.

