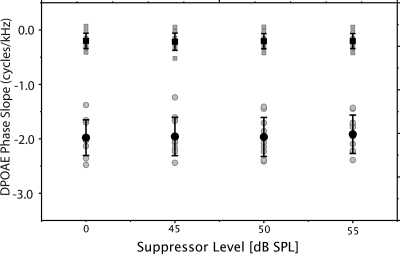
Figure 4.
Fitted phase slopes (cycles/kHz) from the one-knot spline model. The near-zero, high-frequency slopes [squares] represent the segment above the knot frequency. The low-frequency slope values [circles] represent the segment below the knot frequency. Gray symbols display individual data points. Black symbols represent mean values and error bars, ±1 standard deviation.

