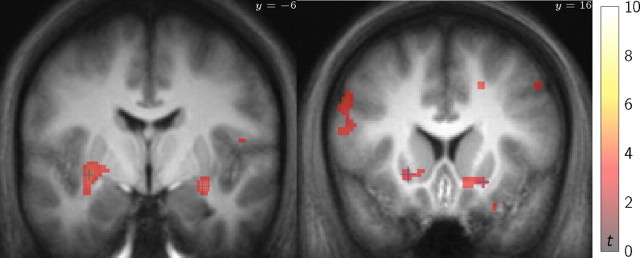
Figure 4.
Identification of value-related voxels of interest. T statistic map of group response size to either planned or TD-based value predictions (summed contrast, shown at p < 0.001, uncorrected; significance not assessed). The most responsive peak voxels of this map anatomically within striatum were identified for additional analysis.

