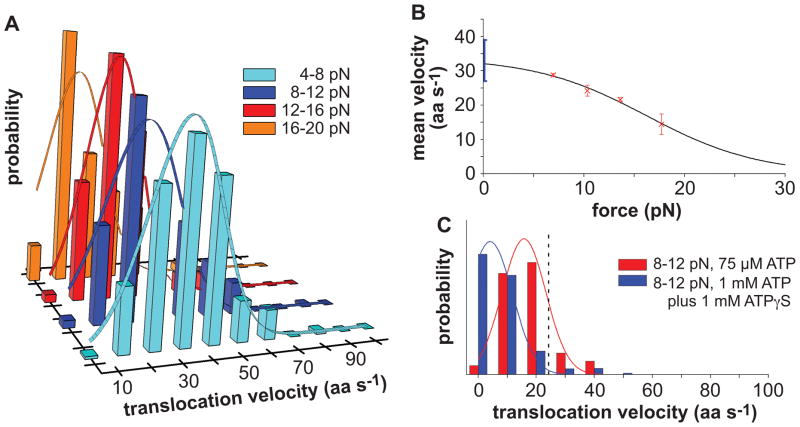
Figure 5. Translocation Velocities at Different Forces and Nucleotide Concentrations.
(A) Histograms with distributions of ClpXP translocation velocities, weighted by the length translocated at that velocity, are shown for experiments using 2 mM ATP in four force regimes. The solid lines are Gaussian fits.
(B) Red symbols are mean velocities from Gaussian fits (± 95% confidence interval), calculated from the panel-A data. The solid line is a non-linear least-squares fit of the force dependence to a single-barrier Boltzmann model (see text). The blue bar represents a range of unloaded velocities from single-molecule and ensemble experiments using different substrates (Martin et al., 2008c; Shin et al., 2009).
(C) Translocation-velocity distributions at 8–12 pN for experiments performed using 75 μM ATP (frequent rupture of bead linkage occurred when less ATP was used) or 1 mM ATP plus 1 mM of ATP S. The dashed vertical line represents the mean velocity for 8–12 pN using 2 mM ATP. Solid lines are Gaussian fits.

