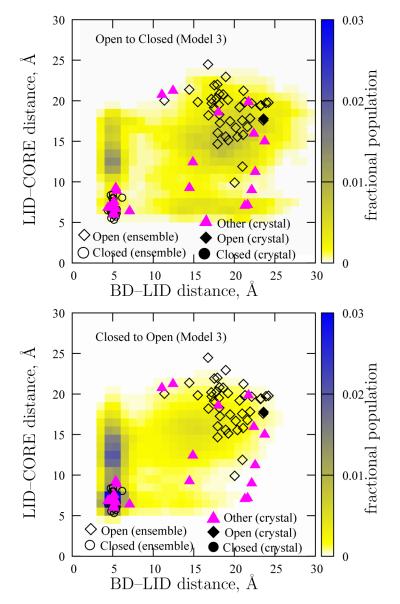
Figure 14.
Fractional populations observed in the transition path ensemmble. The top panel shows fractional populations for the Open–to–Closed direction, whereas the bottom panel is for the Closed–to–Open direction. Also depicted are experimental configurations, including those from which our double–Gō models were constructed (black filled symbols) and a number of others (pink triangles) which are tabulated in the Supplementary Information. Open symbols depict the equilibrium ensembles obtained from simulation.

