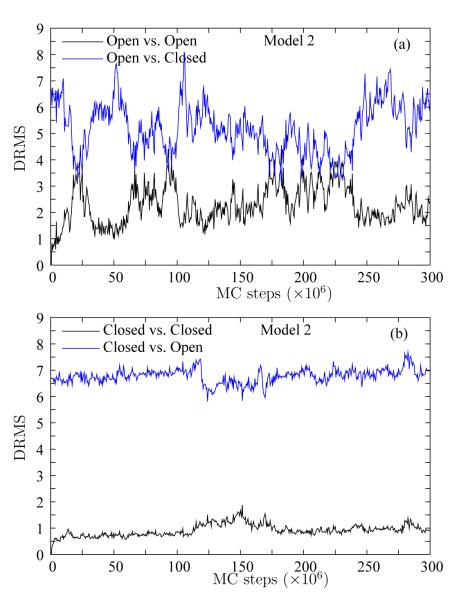
Figure 4.
Stability of the native basins in Model 2. The DRMS in Model 2 (Gō, H-bonding, Ramachandran propensities, and MJ–type residue specific interactions) is shown for two simulations (a) starting from the Open structure and (b) starting from the Closed structure. For each simulation, we show the DRMS from the starting structure (black line) and the opposing structure (blue line). Neither simulation show a transition to the opposing structure, but the scales of fluctuations are very different.

