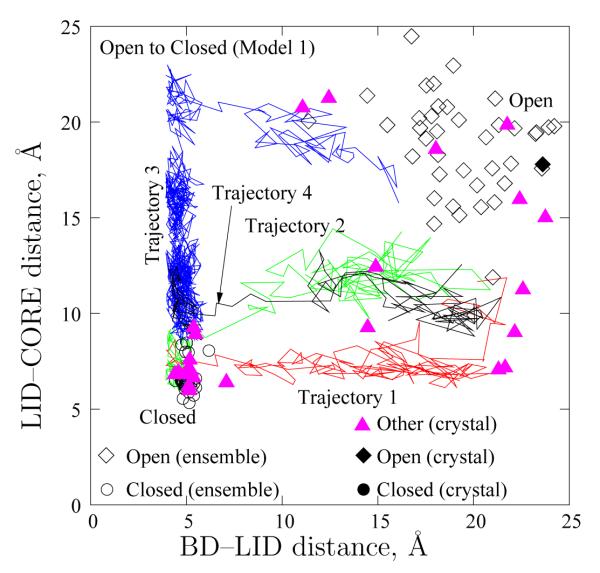
Figure 7.
Path heterogeneity in Model 1 transitions. Four typical trajectories for the Open–to–Closed transition (cf. Figure 6) are shown via distances between the CORE and LID (ordinate) and between the BD and the LID (abscissa). Also depicted are experimental configurations, including those from which our double–Gō models were constructed (black filled symbols) and a number of others (pink triangles) which are tabulated in the Supplementary Information. Open symbols depict the equilibrium ensembles obtained from simulation. The “dwell” times for the trajectories in the Open state have been excluded for clarity.

