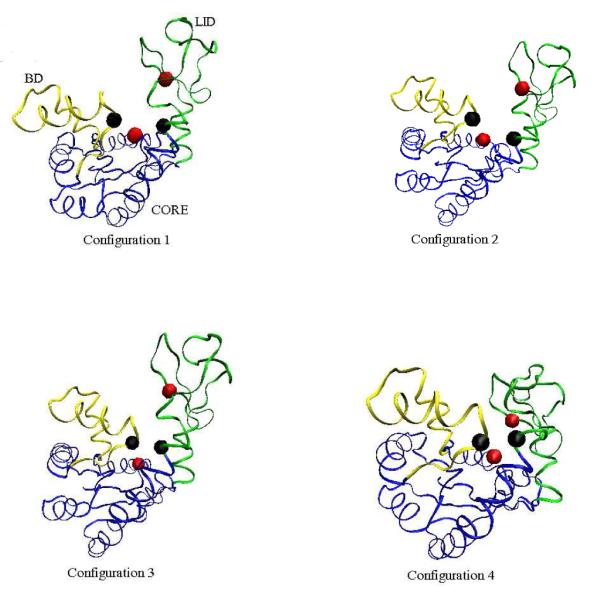
Figure 8.
Four time–ordered, representative structures along the Open–BD–LID–Closed path obtained for Trajectory 3 in Figure 7 (Model 1). The CORE domain is blue, the BD is yellow, and the LID is green. The configurations correspond to (296000, 802000, 822000, 1496000) MC steps, respectively, in Trajectory 3 of Figure 6.

