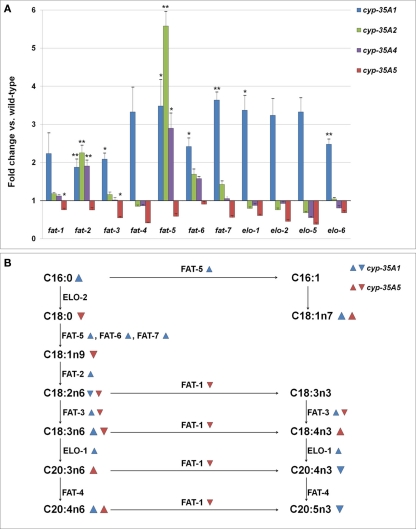
Figure 5.
(A) Changes in the expression levels of fatty acid synthesis genes (fold change compared to wild-type ± SEM). *t-test p-value < 0.05, **t-test p-value < 0.01, ***t-test p-value < 0.001. (B) Schema of the synthesis of fatty acids and the enzymes involved.  = fatty acid percentage or gene expression increased in cyp-35A1 mutant,
  = fatty acid percentage or gene expression decreased in cyp-35A1 mutant,
  = fatty acid percentage or gene expression increased in cyp-35A5 mutant,
  = fatty acid percentage or gene expression decreased in cyp-35A5 mutant.

