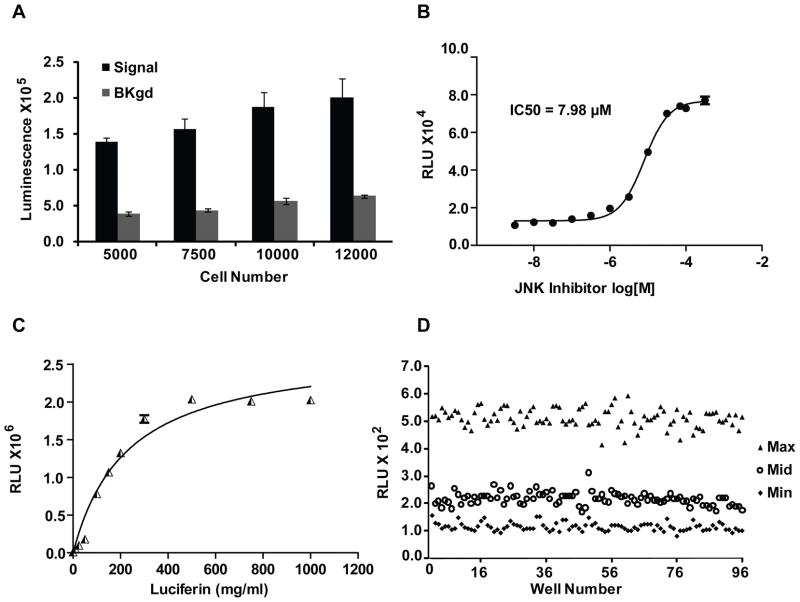
FIG. 3.
HTS Optimization. (A) Effect of seeding density on signal and background in 96-well plates. Cells were seeded at 5000, 7500, 10000 and 12000 cells/well. Signal and background represent A549 FKR cells treated with 20 μM JNK inhibitor and DMSO respectively. Values represent the mean ± SEM of 2 separate experiments, each with 4 replicates. (B) 96-well dose dependent inhibition of FADD kinase activity in A549 FKR cells. Cells treated with JNK inhibitor (SP600125) as described in Materials and Methods. Three independent experiments were performed with 8 replicates for each dose. Data points represent the mean ± SEM for each condition. (C) Effect of luciferin concentration on cellular response. A549 FKR cells were treated with multiple doses of luciferin and imaged 5–10 minutes following substrate addition. (D) Representative results of 96-well assay performance. Cells were treated with 0, 15 and 30 μM JNK inhibitor for min, mid and max measurements respectively. The average Z-factor of 0.62 indicates assay suitability for high throughput screening.

