FIG. 5.
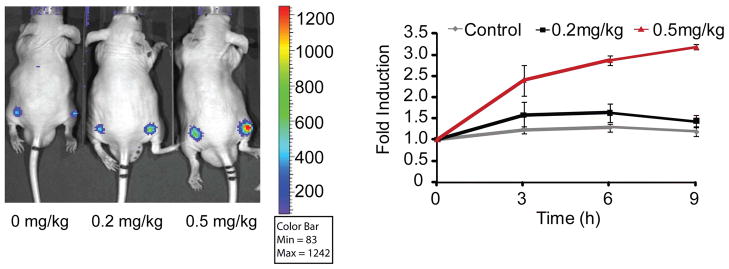
Time and Dose Imaging of FKR Activity. Representative image of CD-1 nude mice transplanted with A549 FKR cells and treated with 0.2 mg/kg and 0.5 mg/kg CK1α inhibitor. DMSO served as the control. Mice were imaged at 0, 3, 6 and 9 hours following compound injection. Graph represents induction of bioluminescence at each time point. Fold induction was calculated for each time point as the ratio of bioluminescence activity following treatment and the basal bioluminescence prior to treatment. Data shows a time and dose dependent increase in bioluminescence in vivo.

