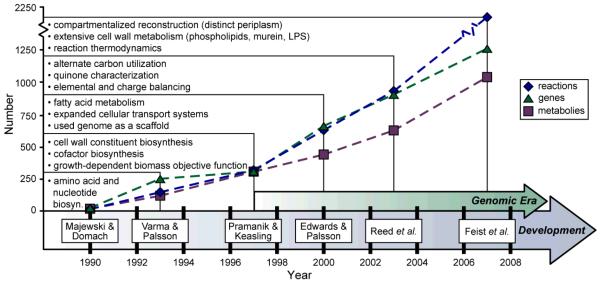
Figure 2. The ongoing reconstruction of the E. coli metabolic network.
History of the E. coli metabolic reconstruction. Shown are six milestone efforts contributing to the reconstruction of the E. coli metabolic network. For each of the six reconstructions 12-19, the number of included reactions (blue diamonds), genes (green triangles) and metabolites (purple squares) are displayed. Also listed are noteworthy properties that each successive reconstruction provided over previous efforts. For example, Varma & Palsson13, 14 included amino acid and nucleotide biosynthesis pathways in addition to the content that Majewski & Domach12 characterized. The start of the genomic era92 (1997) marked a significant increase in included reconstruction components for each successive iteration. The reaction, gene and metabolite values for pre-genomic era reconstructions were estimated from the content outlined in each publication and in some cases, encoding genes for reactions were unclear.

