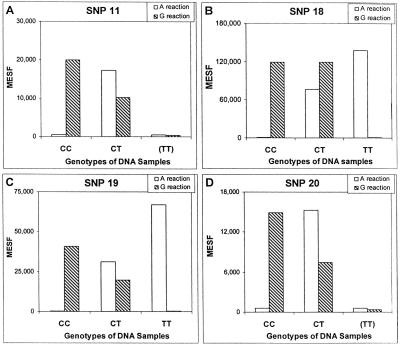
Figure 2.
SNP analysis in multiplexed reactions. PCR products were amplified individually from genomic DNA with either homozygous genotypes (CC and TT) or heterozygous genotype (CT). PCR products were then pooled according to their known genotypes into three separate groups. For example, one pool contained the homozygous PCR products (CC) from the four SNPs and so on. The three pools (15 ng of each PCR products) were used as templates and assayed separately for either A or G (striped columns) incorporation with the antisense probe as described in Methods. The MESF values from each of the three genotypes for each SNP are grouped together and shown. About 10,000 microspheres were pretreated with BSA at 1 mg/ml for 45 min and then added to each reaction to capture the SBCE products. The fluorescent intensity of the microspheres is represented by the MESF values on the y-axis. A pair of numbers from the A and G reactions determine the genotypes of the samples analyzed. Genotypes of the DNA samples were labeled as CC, CT, and TT. The absence of the PCR products for SNP11 and SNP20 for the TT allele is indicated by (TT).

