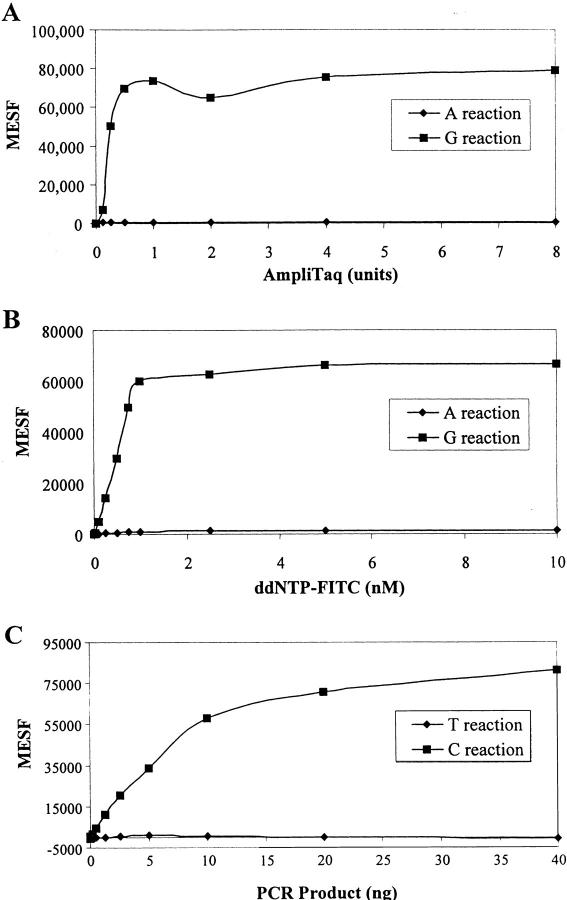
Figure 3.
Optimization of SBCE reactions. The MESF values in the y-axis represent the mean fluorescence per microsphere. (A) Titration of the AmpliTaq FS enzyme for SNP18 in a multiplex reaction of four SNPs as used in Figure 2. A mixture of 15 ng PCR products containing homozygous CC genotypes was used as template for either G (█) or A (♦) reactions and the assays were performed with the anti-sense probe as described in Methods. A total of 10,000 microspheres were used for each reaction. The value obtained from the reaction in the absence of enzyme was subtracted from the data points. (B) Titration of ddNTPs for SNP18 was done using the same multiplex conditions as in (A). The experiments were performed with various amounts of fluorescent-labeled ddNTP. The ratio of labeled to unlabeled ddNTPs was kept constant at 1:3. The signals remained fairly consistent for the G reactions (█,) at and above 0.75 nm of ddGTP; A reactions (♦) remained near 0. The results for the other three SNPs are nearly identical to the results shown here. (C) Effect of PCR products on the enzymatic activities. A PCR product (250 bp) generated from a homozygous (CC) DNA sample for SNP18 was used as template for assaying the incorporation of either C (█) or T (♦) nucleotides with the sense capture oligonucleotide.

