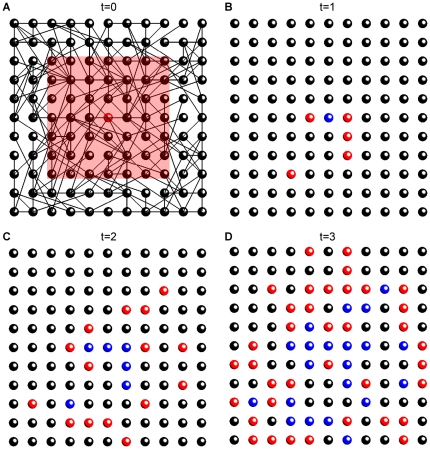
Figure 2. Initiation of wave in a CA model on a random network.
The first 4 time steps of wave initiation are shown for an 11×11 network. A. t = 0; B. t = 1; C. t = 2; D. t = 3. Colorcode: red for active, blue for refractory, black for excitable cells. Lines show links between cells, red square shows the connectivity footprint of the central cell (shown only in A). Parameters:  = 4,
= 4,  (small for demonstration purposes).

