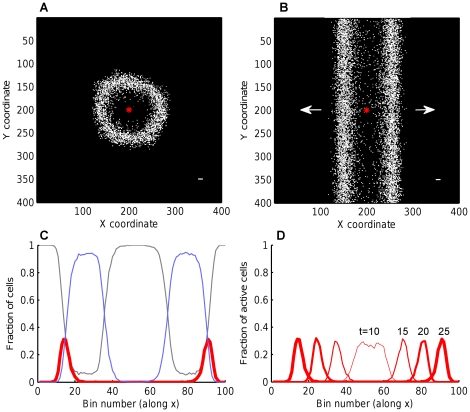
Figure 3. Traveling waves of activity in random networks.
Traveling waves emerging in the CA model on random networks with A. square, B. quasi-1D connectivity footprint. The cell which initiates the wave is shown by a red asterisk. Active cells are white, refractory and excitable cells are black. Directions of wave propagation are shown by arrows. C. A snapshot of wave ( ) with spatial profiles of all three states: grey for excitable, bold red for active, light blue for refractory cell density. In the center, the wake of excitable cells (grey) grows by recovering from the refractory state (blue). D. Profiles of the active state at four time steps, showing two traveling waves emerged from a single active cell. Once formed, the speed and width of a wave remain constant. Profiles were calculated by averaging active cell counts over 100 bins along X. Parameters
  ,
,  (
( is shown in the bottom right corners in A,B).

