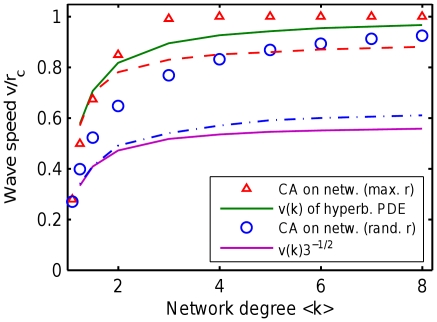
Figure 5. Wave speed derived from the hyperbolic PDE compared to CA simulations.
The wave speed  (red line, high) is derived assuming all links have maximum length. CA simulations are shown in two variants, with maximum-length links (red triangles) and generic random-length links (blue circles). The naive speed scaling
  (blue line, low) is derived assuming that link lengths are uniformly distributed. This discrepancy is explained in Results, showing that maximum-length link is a better predictor of wave speed. The dashed lines show the high-order analysis, proving that the hyperbolic PDEs capture the wave behavior sufficiently well, and derivatives of order above 2 are not necessary.

