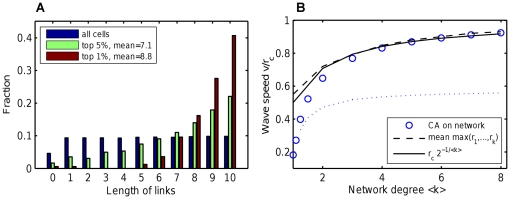
Figure 6. Role of maximum link lengths in wave propagation.
A. The distribution of link lengths between the cells at the wave front, and the cells which triggered their firing. The front cells (top 1 or 5 %) were selected by their positions in a wave. The mean distances are given in the legend, parameters  ,
,  . B. Estimate of the wave speed by numerical estimate of mean maxima of
  i.i.d radii taken from uniform distribution
  (broken line). The formula
  is the expected value of the mean maxima (solid line). The CA simulations of wave speed are shown by circles. As seen, the mean maxima give a good wave speed estimate, in contrast to naive scaling
  derived earlier from the PDE (dotted line).

